This post illustrates how to do the following using ggplot2:
- Draw a simple line plot.
- Change labels on the axes.
- Change the color of the plotted line and increase its thickness.
- Change the default background color of the area in which line is plotted.
Load ggplot2 package and create data for plotting
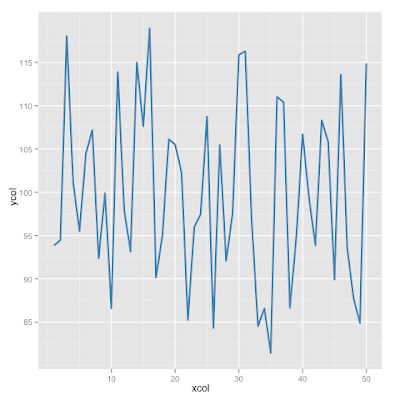
Line plot using ggplot2 with all default options
The output is:
The part aes(x=xcol, y=ycol) in above code specifies the aesthetic mapping, i.e., mapping between data and the things we can perceive on the plot. For instance, in the example above x-position on plot is mapped to data in column xcol and y-position on the plot is mapped to data in ycol (see Section 4.5 in Hadley Wickham's book on ggplot2) for more on aesthetic mappings.
Plot with custom labels for the axes
In the above plot the labels for the x and y axes are the same as the column names in the data. You can modify these labels if you wish. The following code shows how, using functions xlab() and ylab()
The output is:
Change color of the plotted line and increase thickness
You can change certain properties of the plotted line such as its color and thickness. To change its color, use the color property and to change its thickness use the size property. The default size is 0.5 and the default color is black. The following piece of code illustrates how this is done by specifying these as arguments of geom_line() function.
The output is:
Change the default background color of the plot area
The following code illustrates how to modify the background color:
The output is:
Note the use of opts(panel.background=theme_rect(fill='linen')) line to set the background color. A natural question is, which options other than panel.background can be specified using the opts() function? And, what are the possible theme values of these options? The list of options can be found on ggplot2 wiki page. You can also get the list of options and their default values by using theme_get() at the R prompt.
The following screenshot shows partial output from the theme_get()function:
I will end this post by combining all the different modifications we made above into a single script. The script and its output follow:
Output of the script:


